SaferMe · 2019
Tasks
The majority of Health and Safety is built around accurate and timely reporting. These reports include safety talks, job assessments, hazard identifications, etc. Oftentimes, once the report is made, actions need to be taken on that report. For example, if a worker reported a spillage, someone needs to go clean it up.
SaferMe’s original product offering was focused on making reports quick and easy. However, we didn’t have an easy way to create actions on those reports. In 2019 we decided to address this problem and created a new feature called “Tasks”.
Research
We already had an existing system that allowed users to assign reports to team members. In addition, we had a comment feature. We noticed that many of our users used these two features in combination as a way to assign actions to team members. We reviewed how they were used and formed a list of patterns.
Then, we followed up with those users to ask how they made decisions around actions and how they monitored the progress around those actions.
Now, we had a list of needs and asks. At this point, I brought together the engineering manager, the product manager, and myself to create a design criteria canvas. This is a great tool that allows you to build a clear strategy on how you will attack a feature; what is non-negotiable and what is nice-to-have.
Expectations
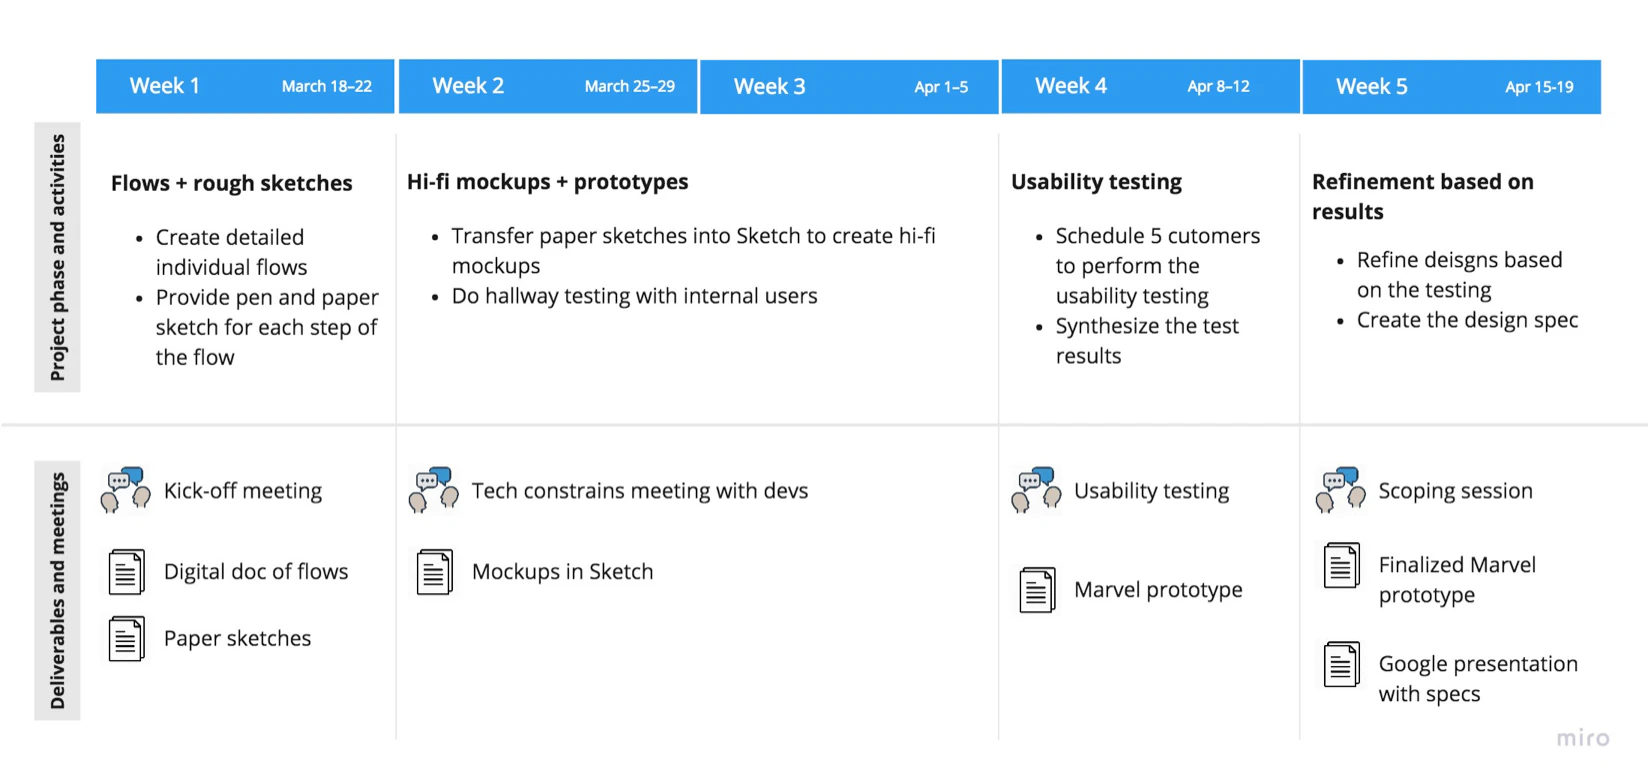
This was the first major project for me with the SaferMe team. I wanted to establish transparency and have the best communication from the get-go. To do so, I created a timeline.
It allowed me to set proper expectations, show the team my process, have early discussions, and learn more about design culture.
Design process
Step 1: User journey
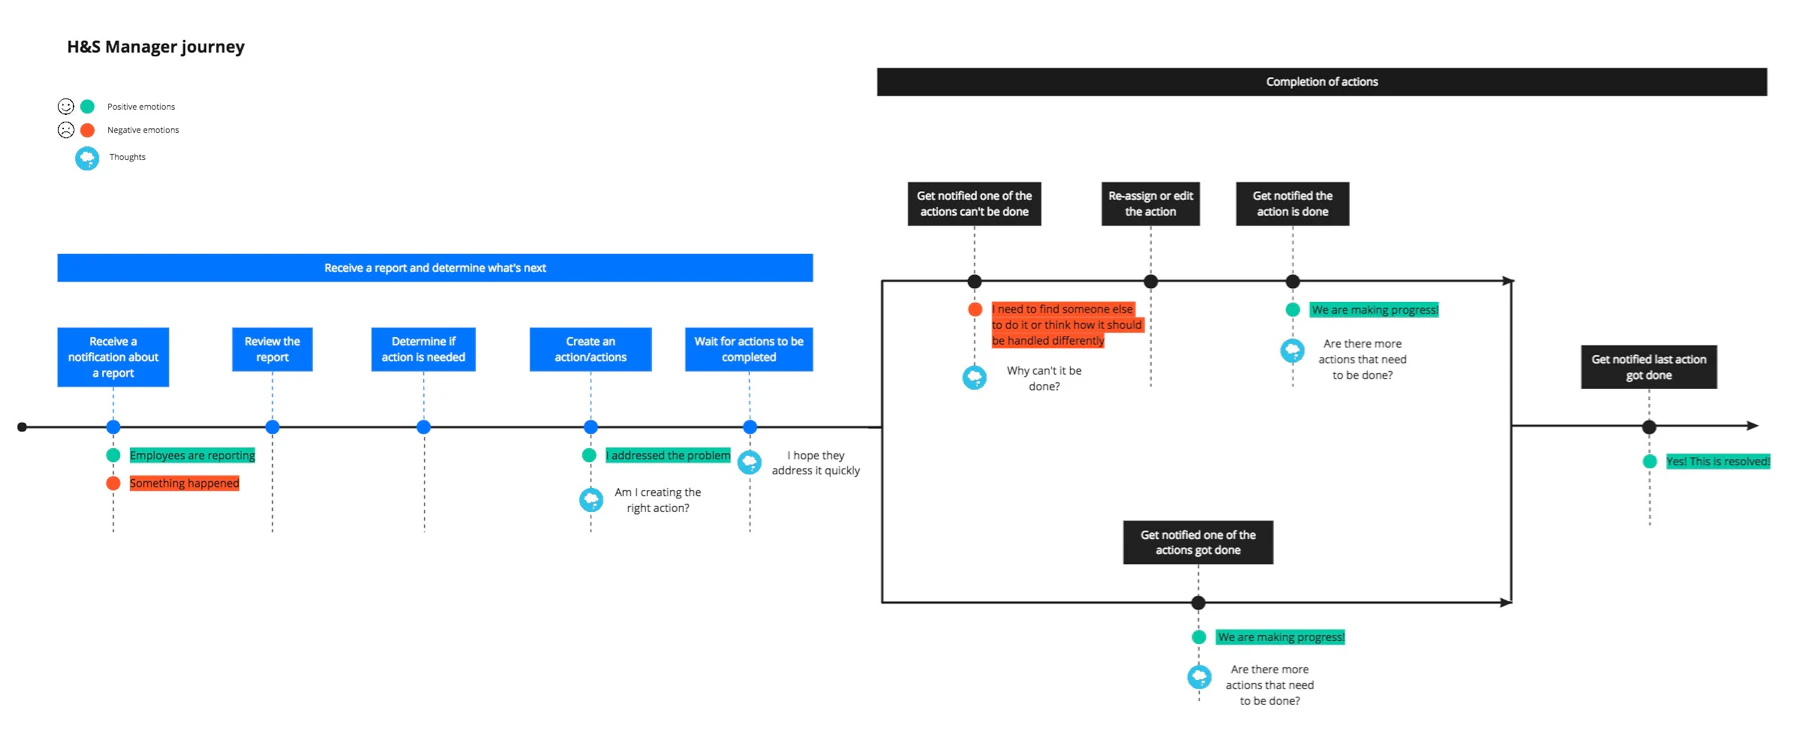
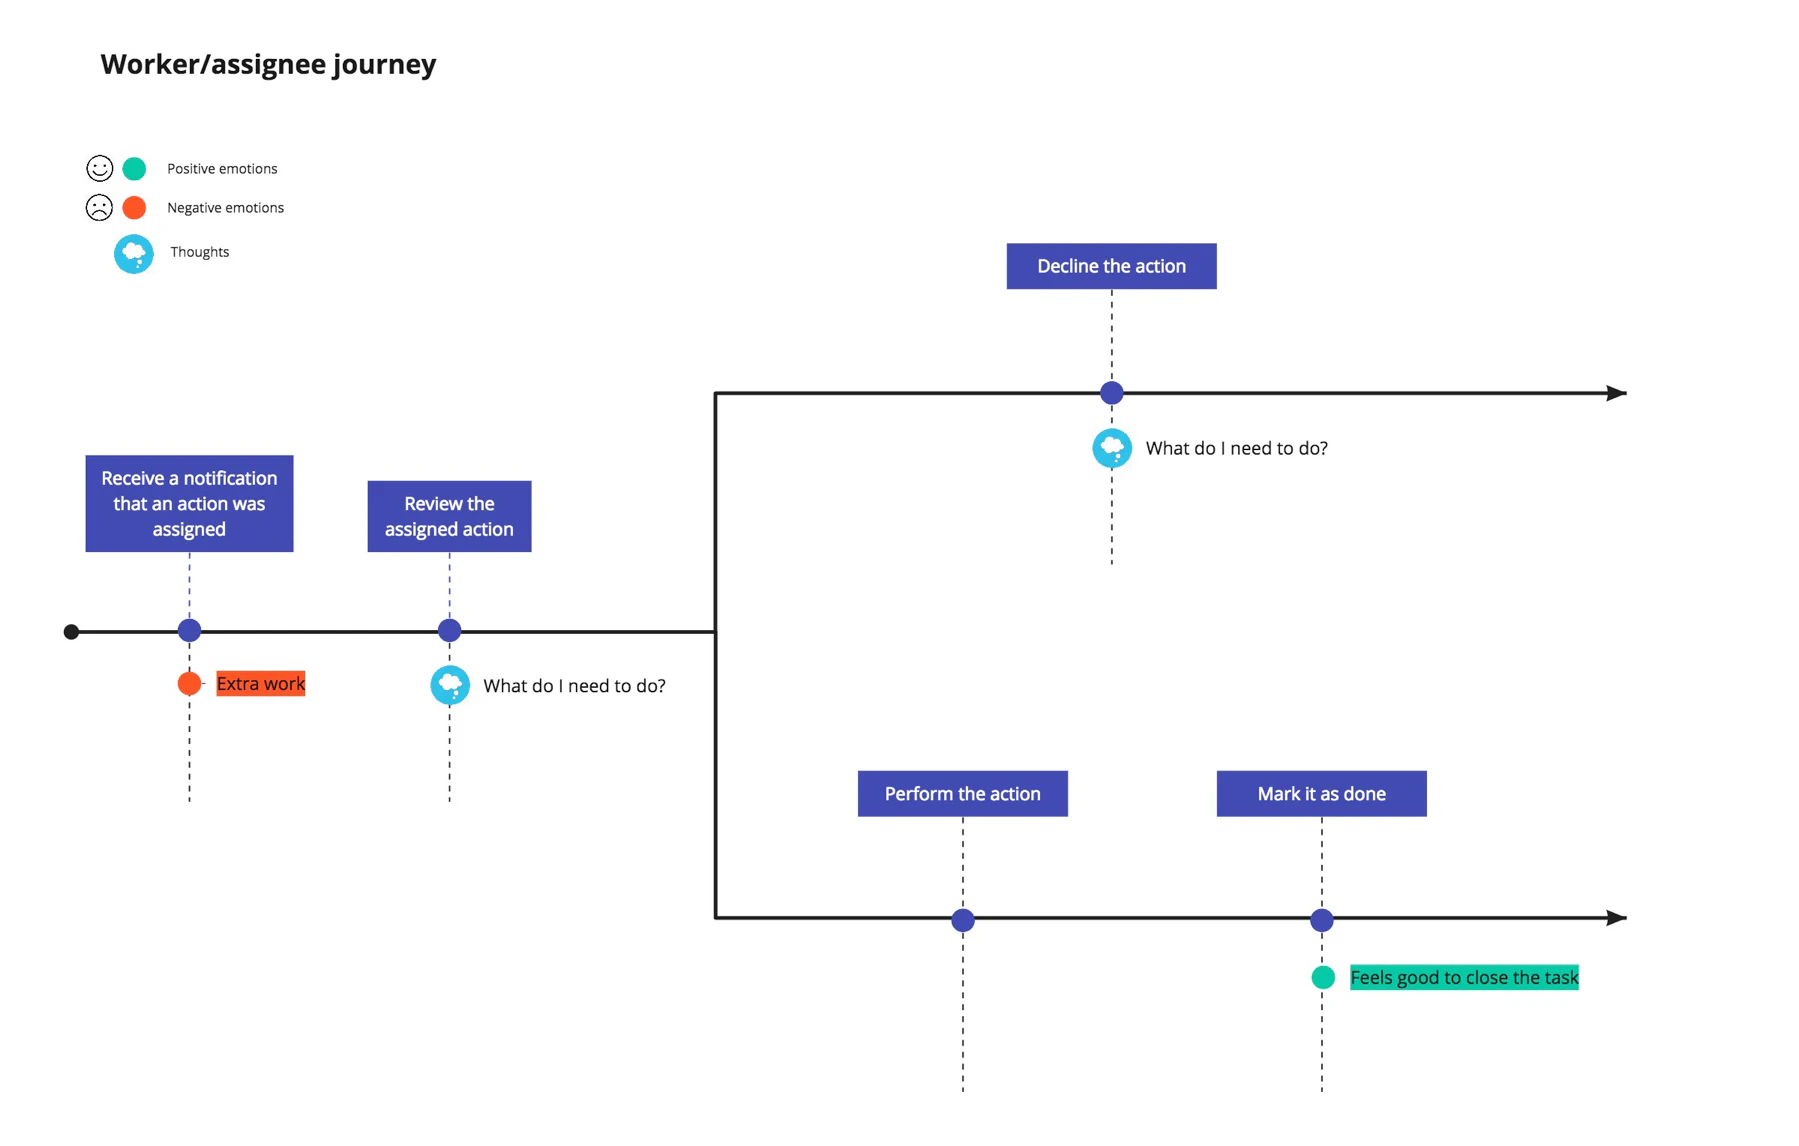
First, we visualized what journey a user will experience. What are potential points of confusion? What are potential points of delight? How journeys can diverge based on actions taken? We had two different personas to cater to: a manager and a worker.
Step 2: Flow diagrams
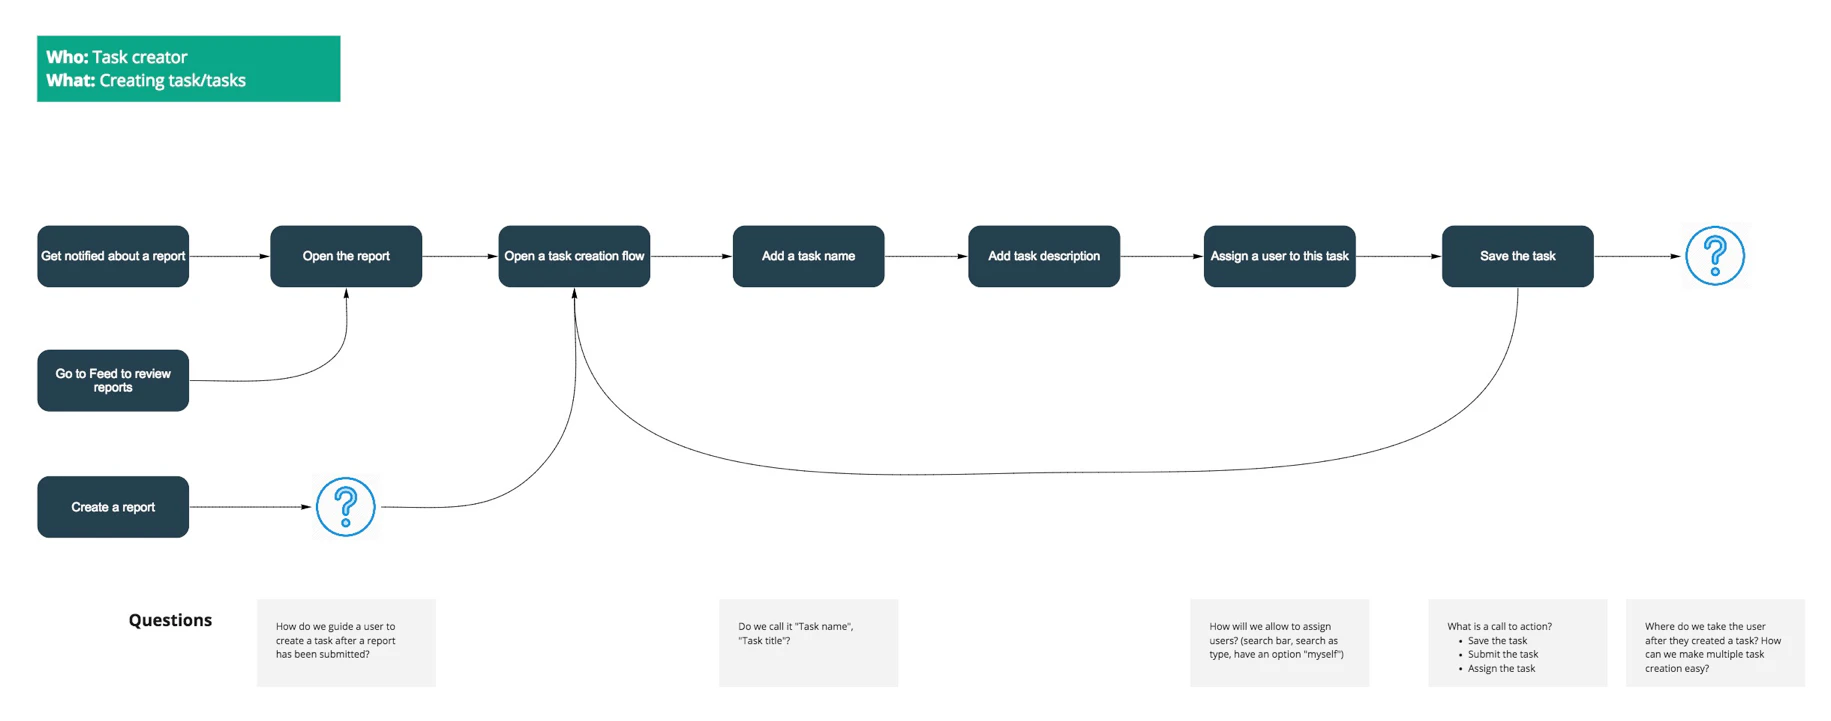
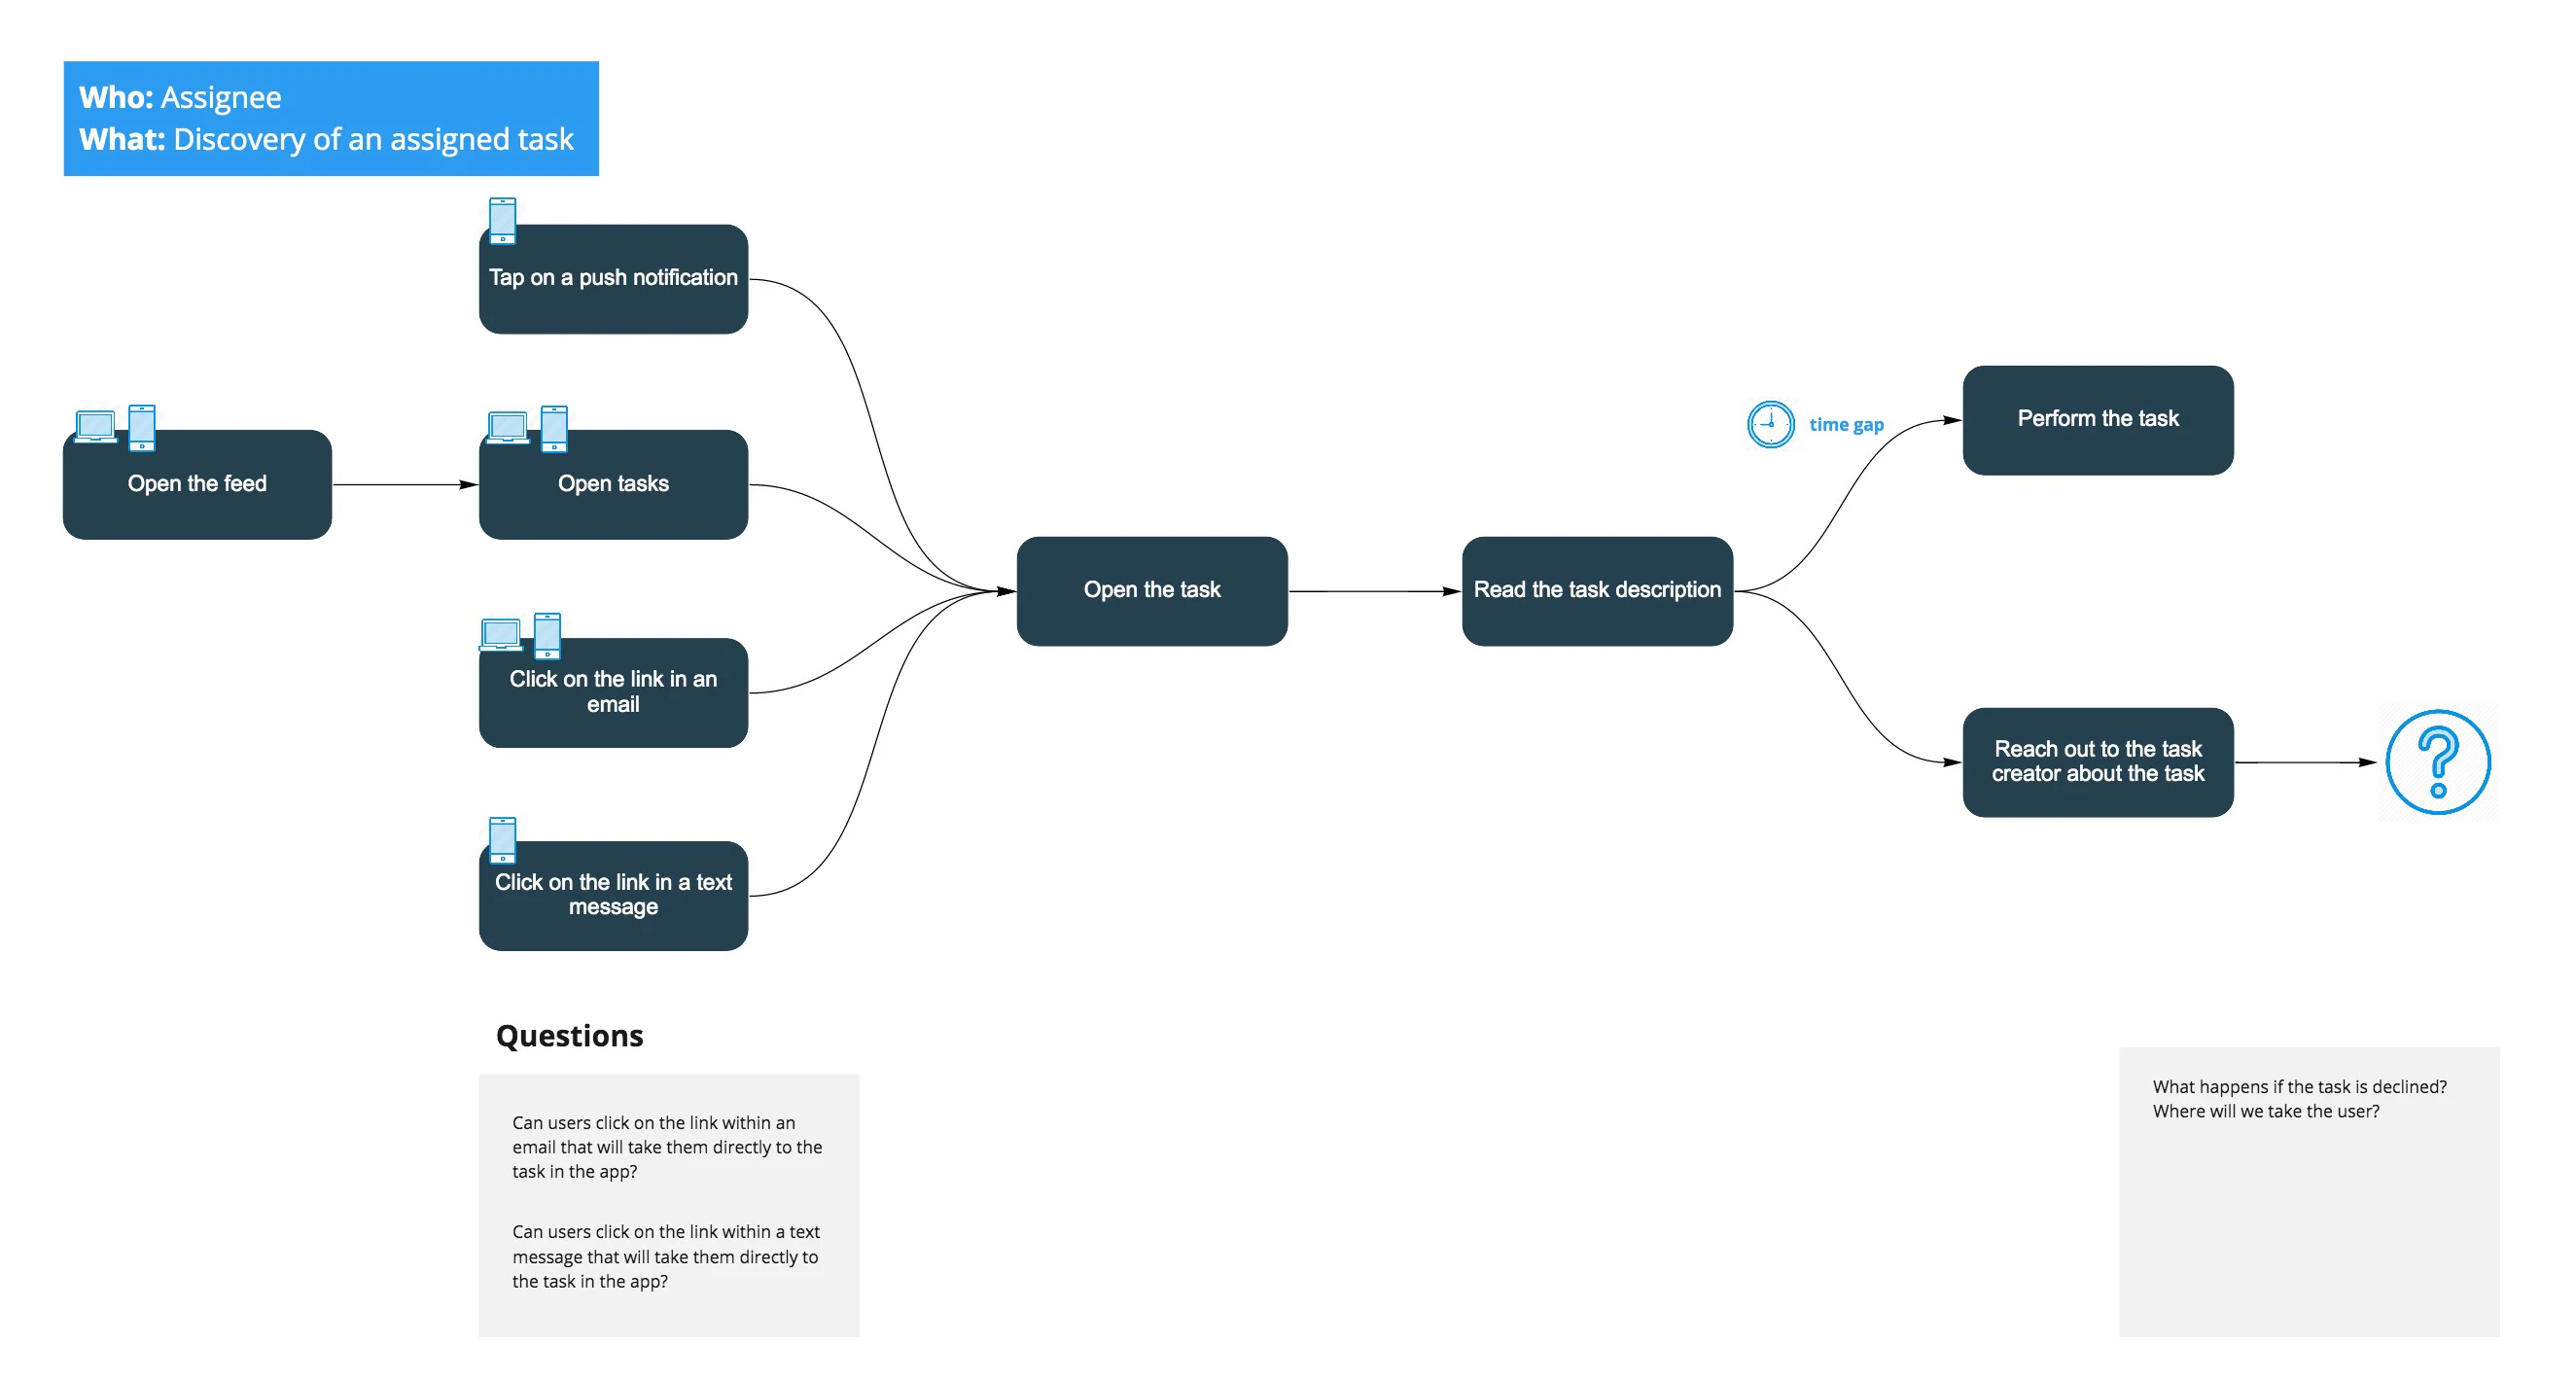
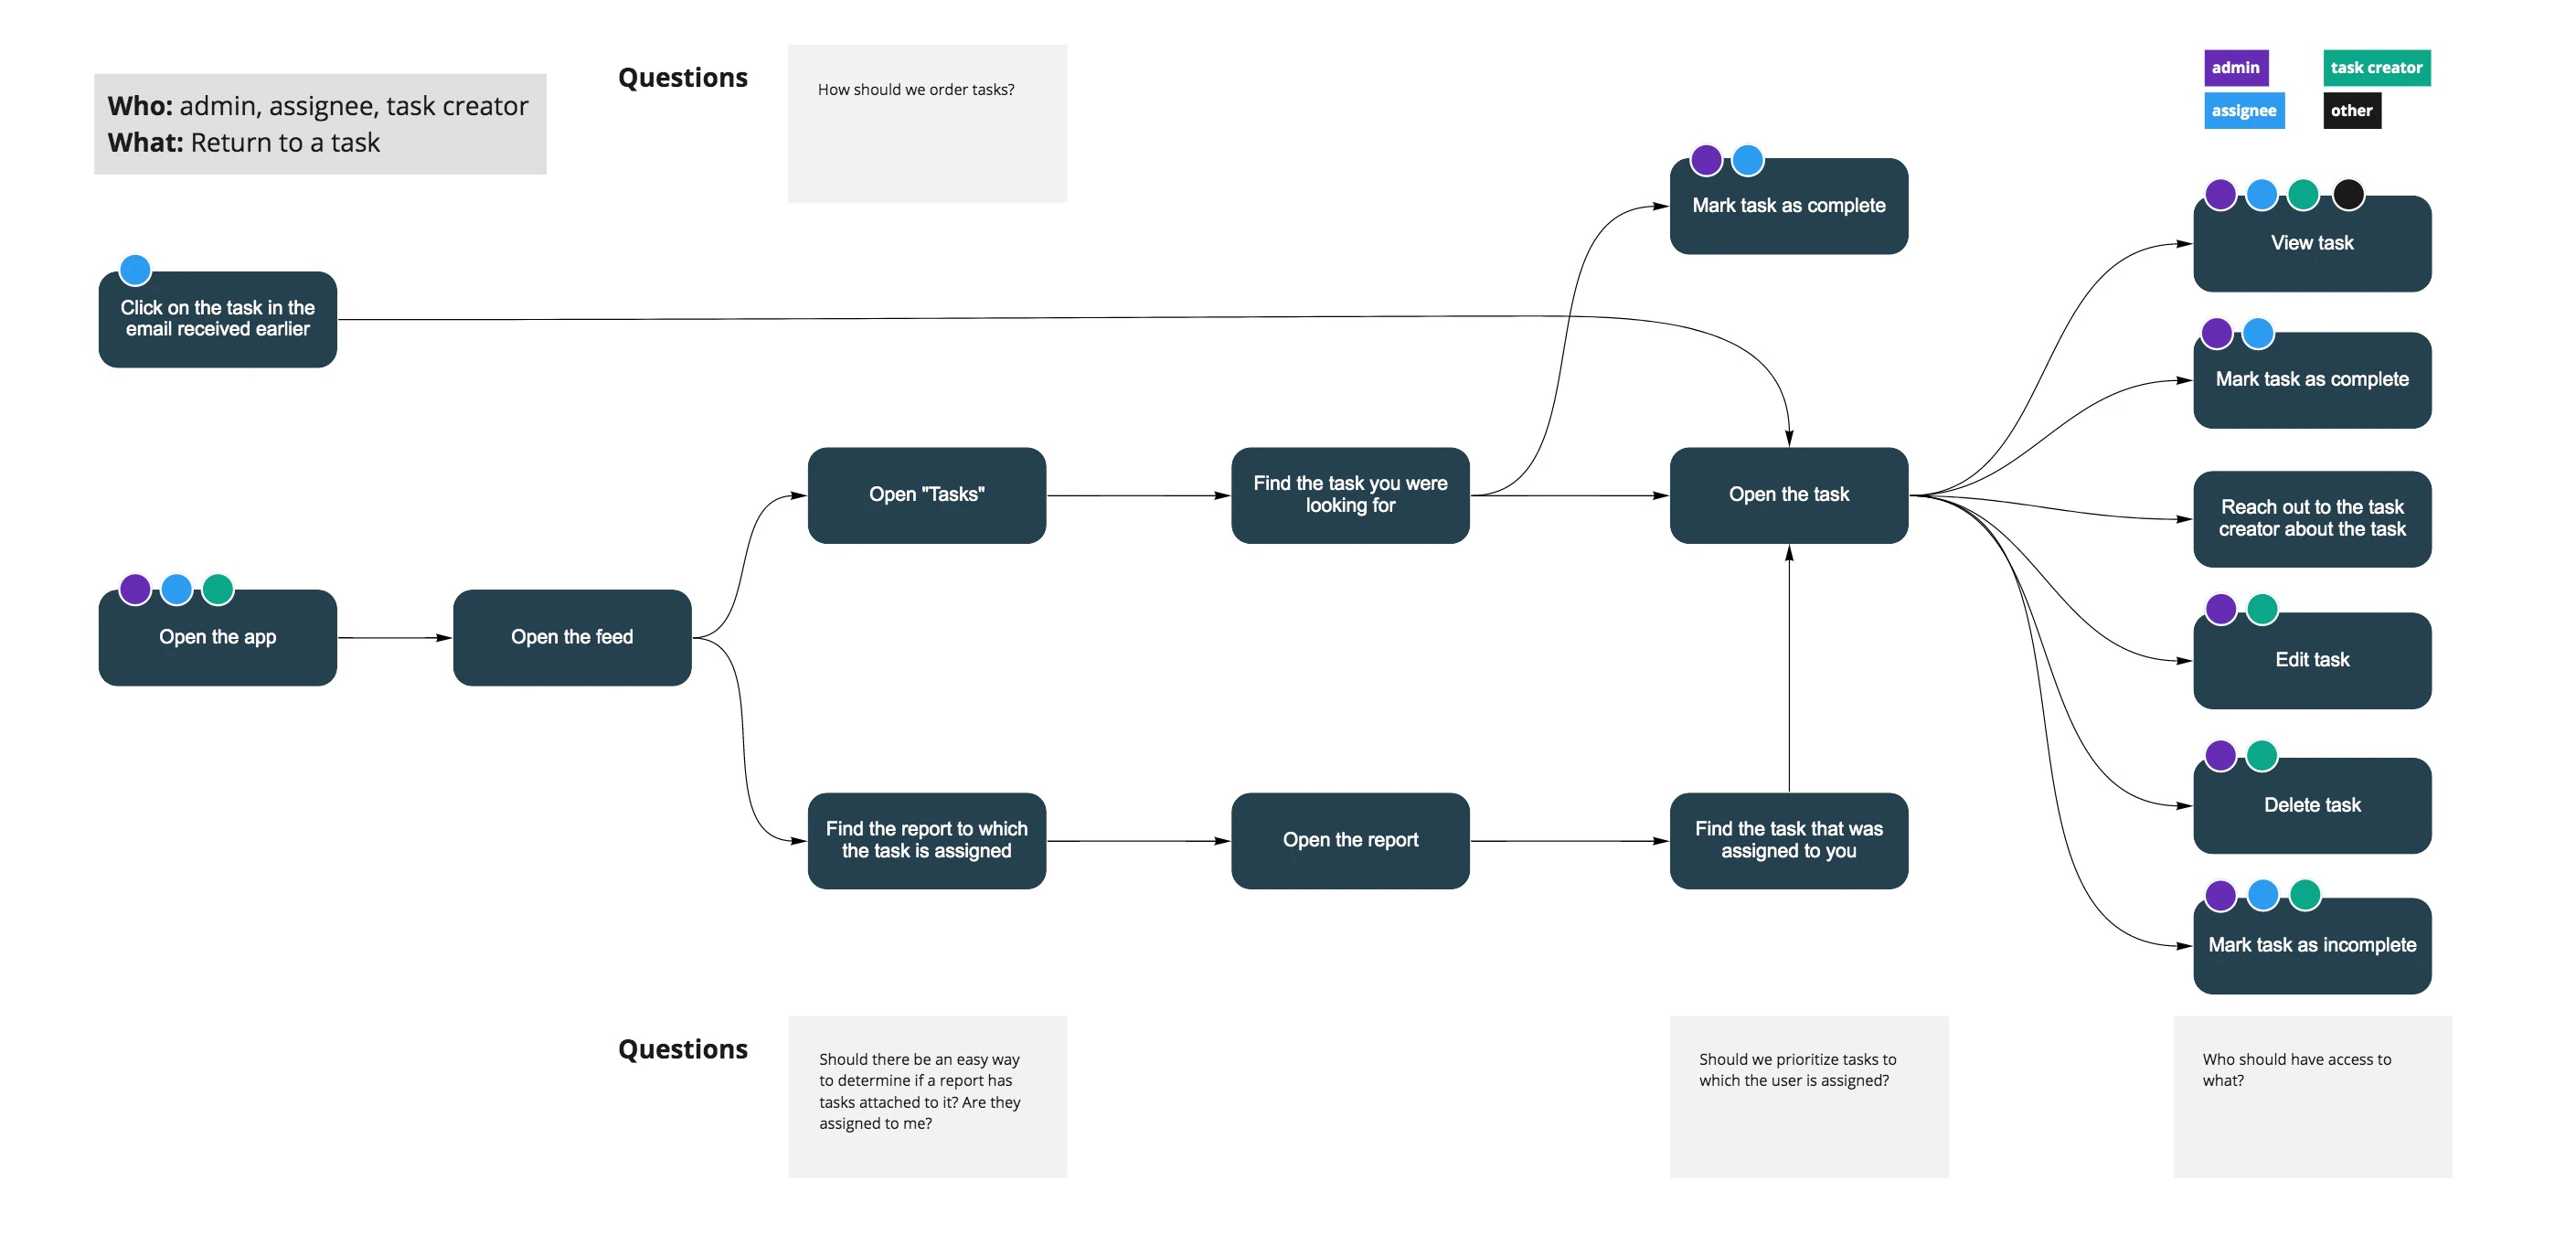
Next, we created flow diagrams. These are great as they helped us understand how a user can move through our product. They also helped to discover missing pieces and raise technical questions.
Step 3: Identifying permissions
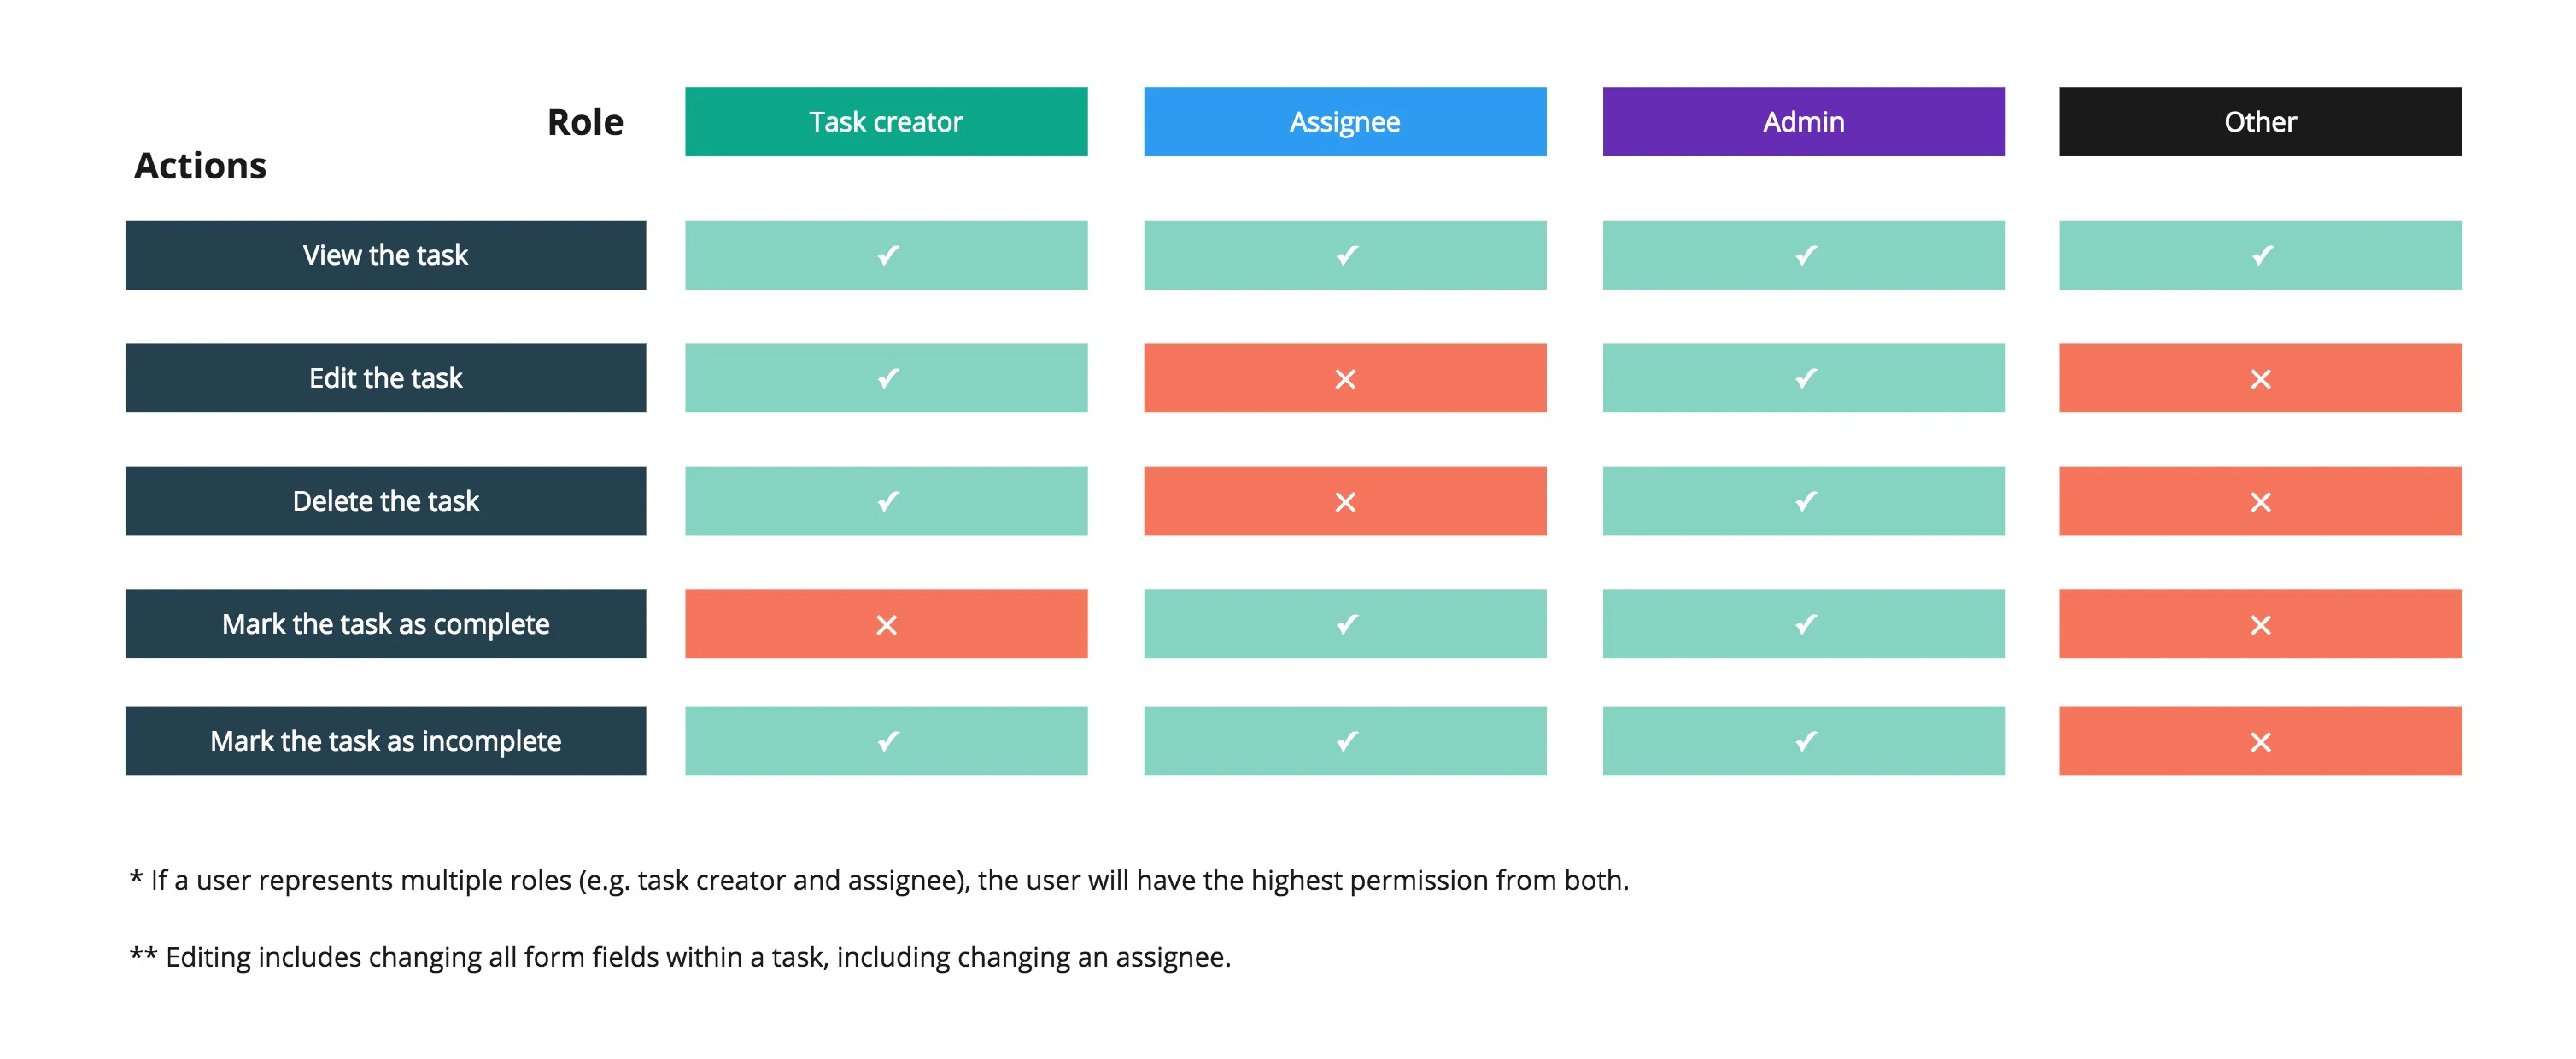
We had multiple roles in this project. Each role would get different permissions.
Step 4: Hi-fidelity prototypes
And finally, designing every screen. As tasks always relate to a specific report, we placed the ability to create tasks within them, with the addition of a new tab called “Tasks”.
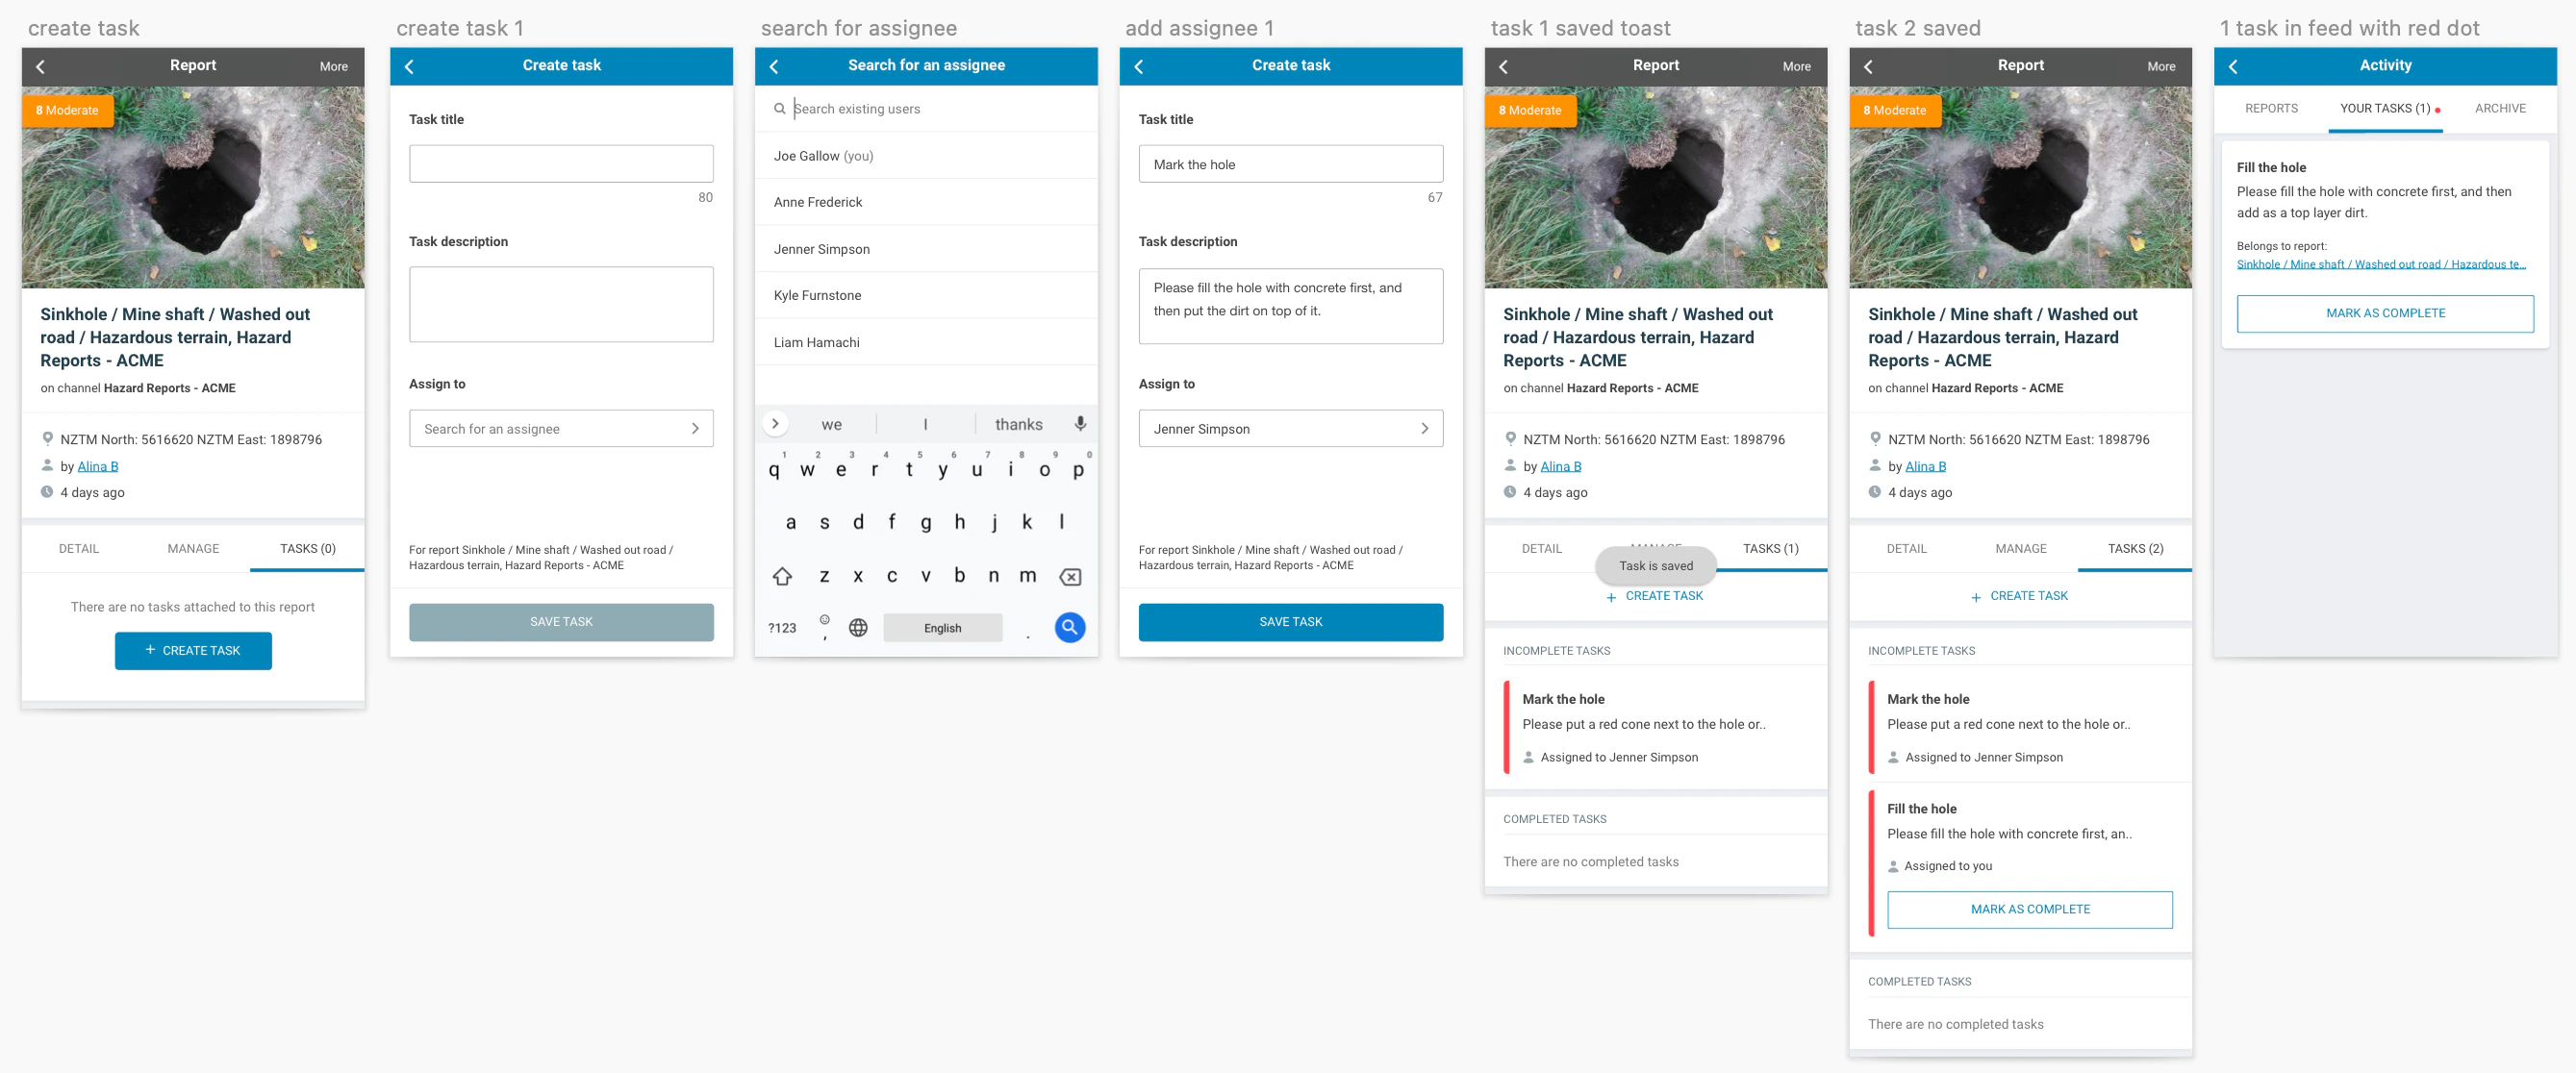
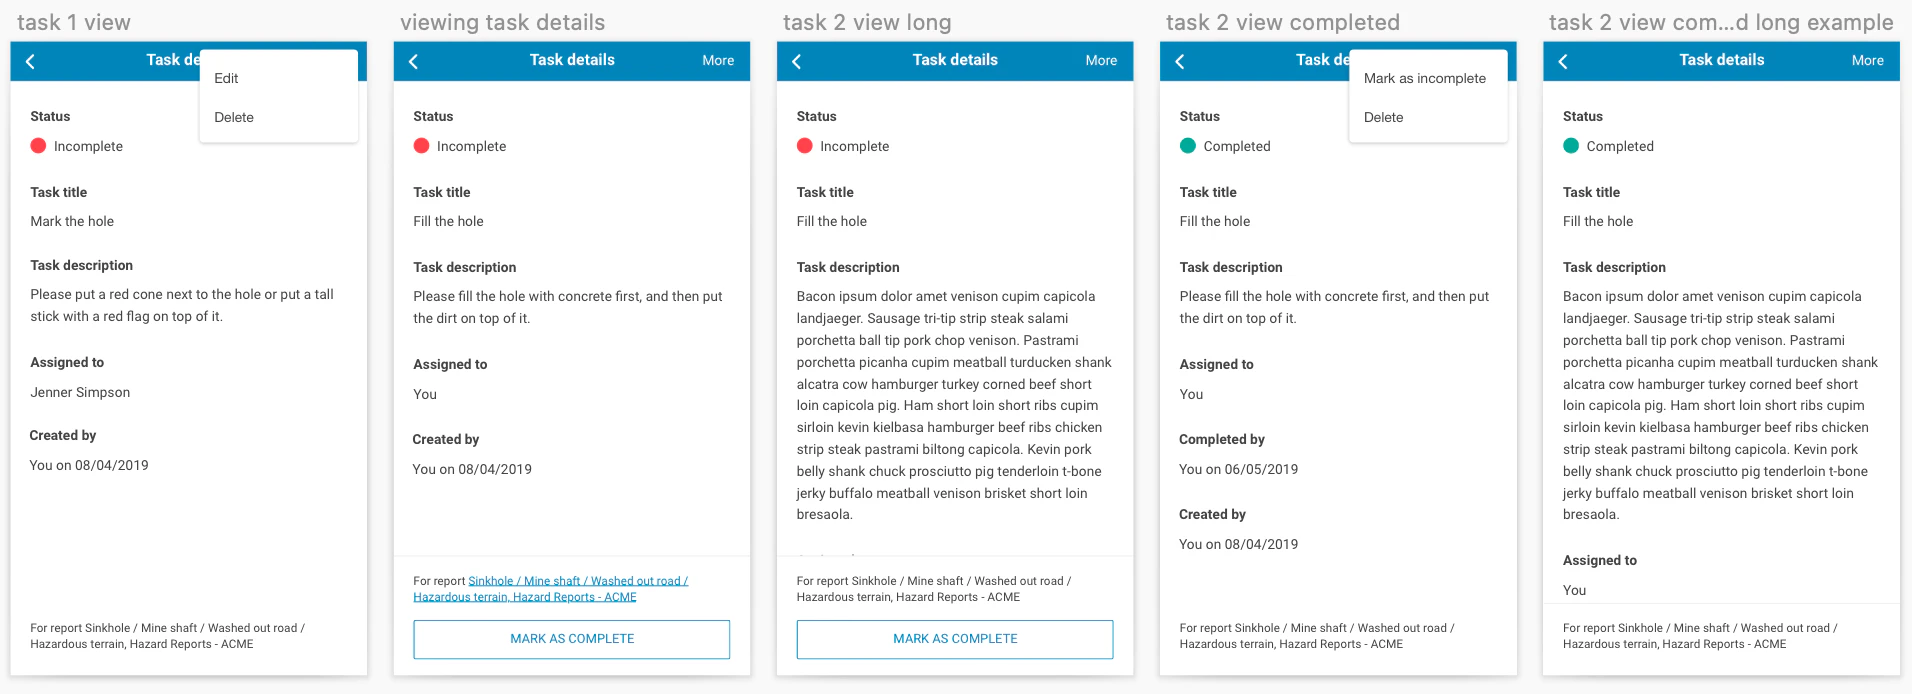
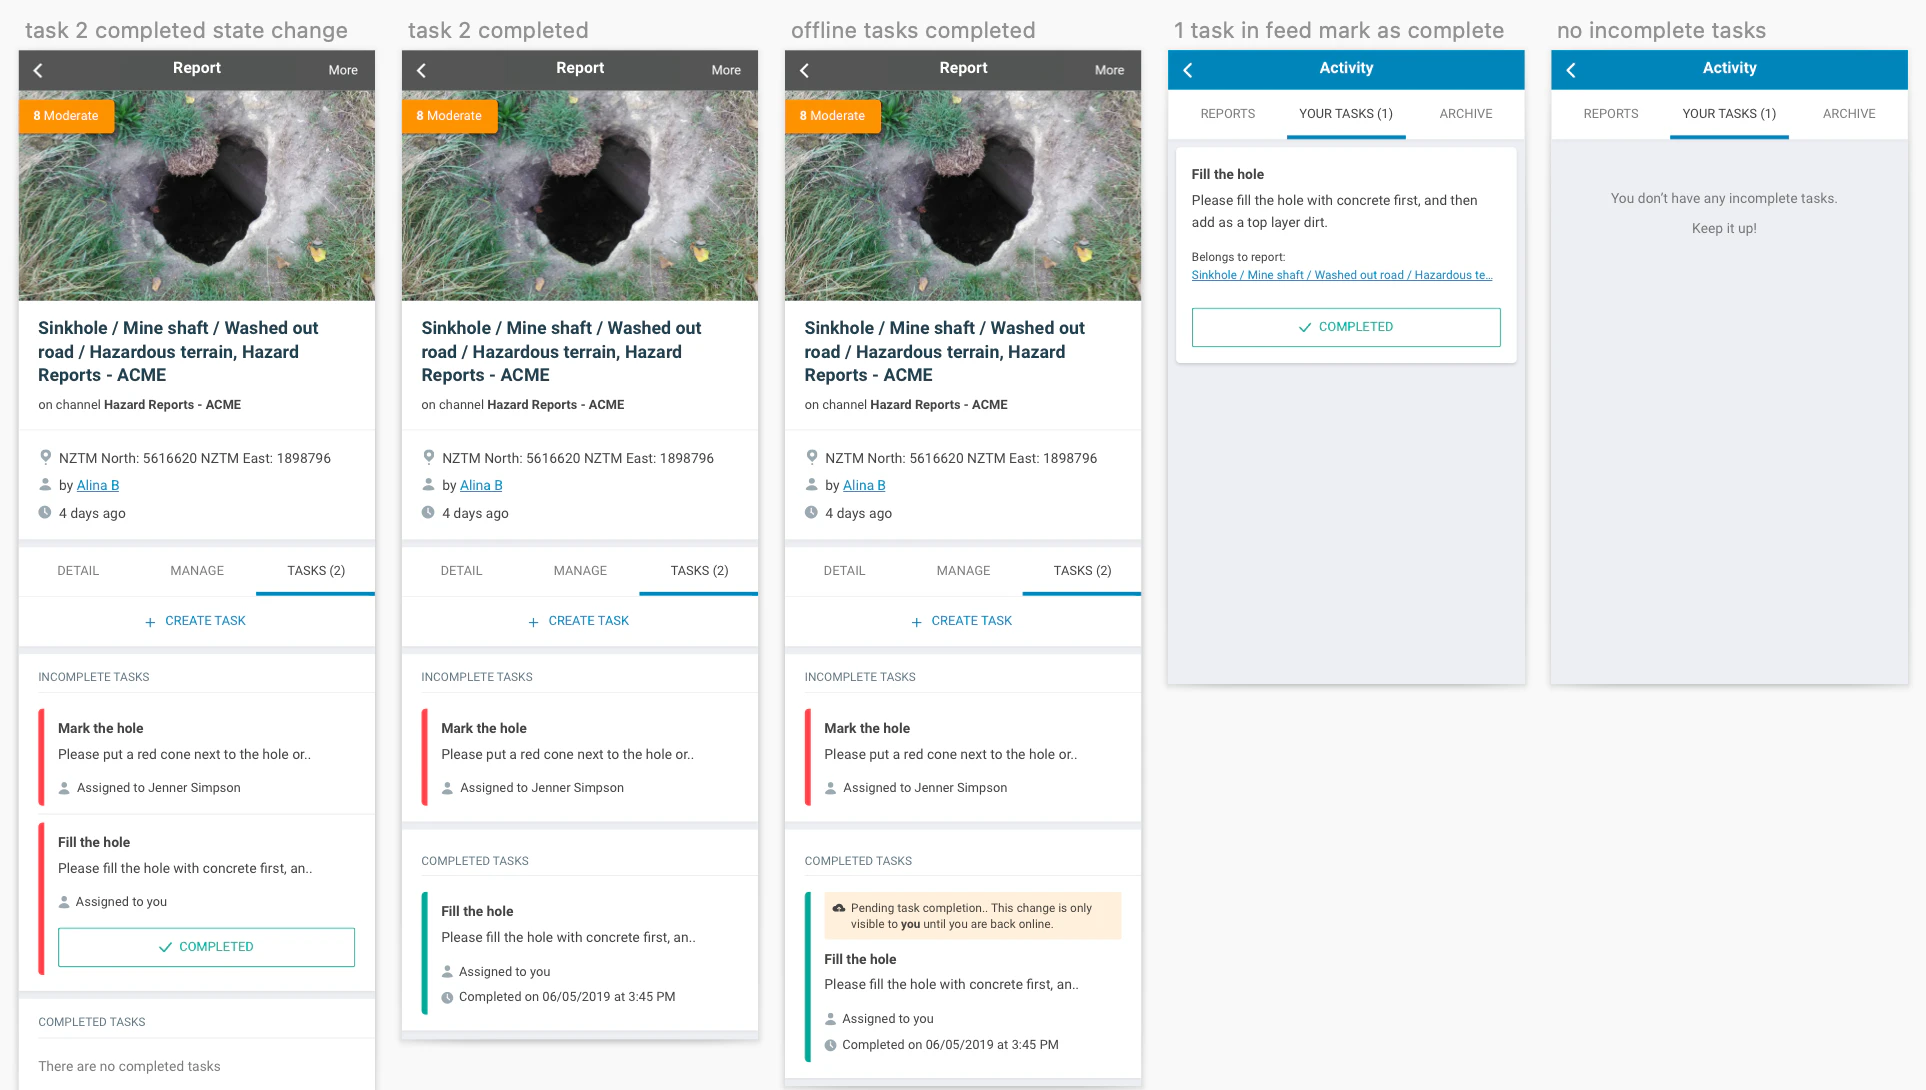
All the screens above had to be replicated for SaferMe’s web app as well.
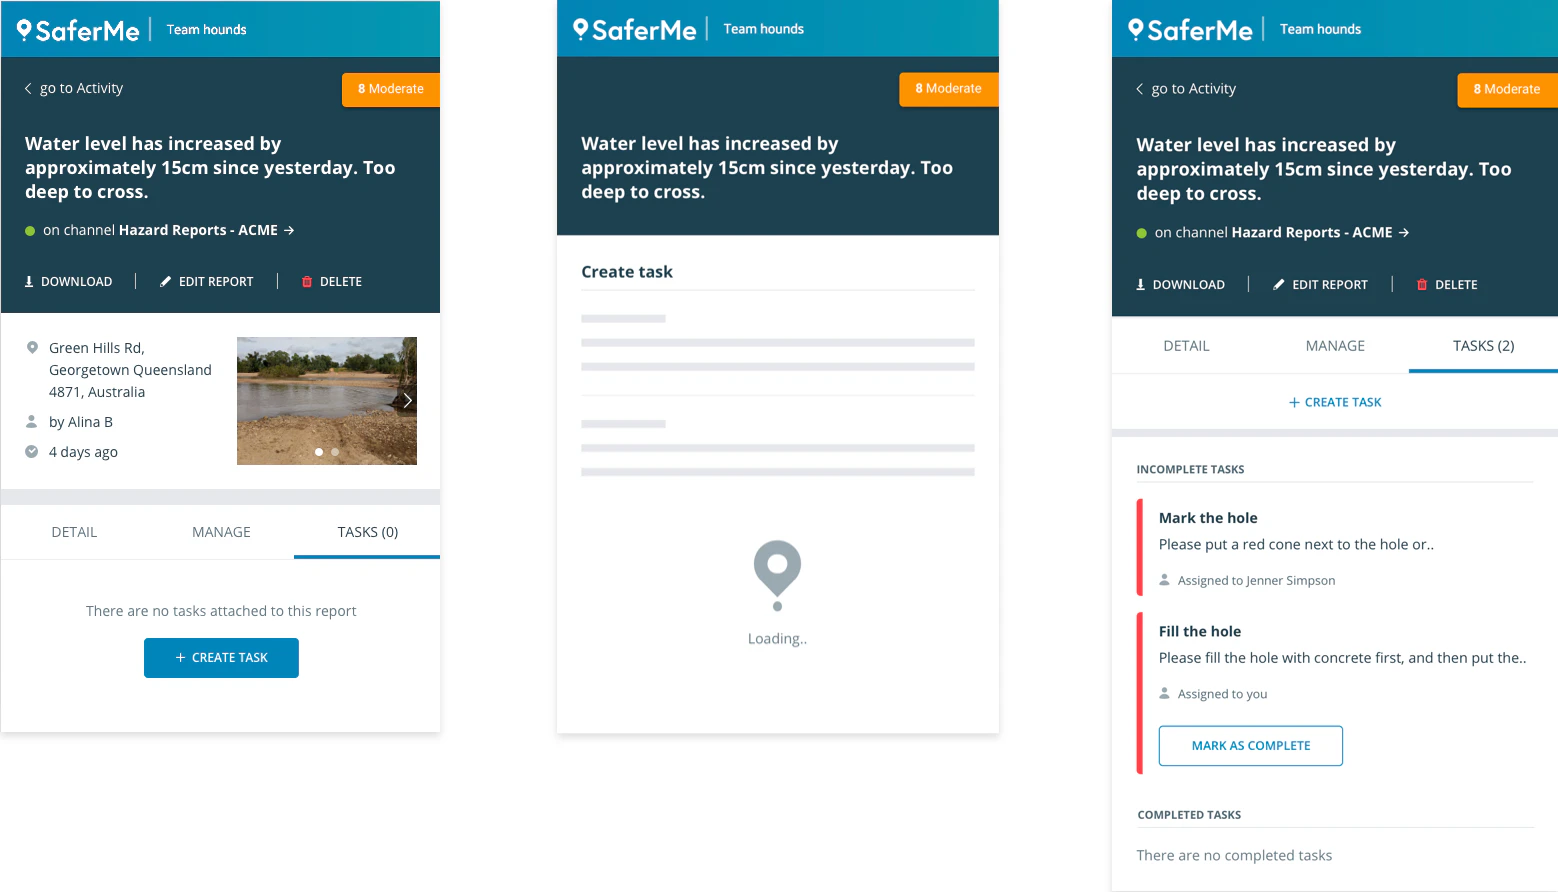
Step 5: Design spec
Lastly, I have produced the design specs to ensure our developers had a clear resource to rely on. I used a combination of Google Slides with Marvel (prototyping tool) to provide all necessary information on behaviours, styles, and information architecture.
Measuring
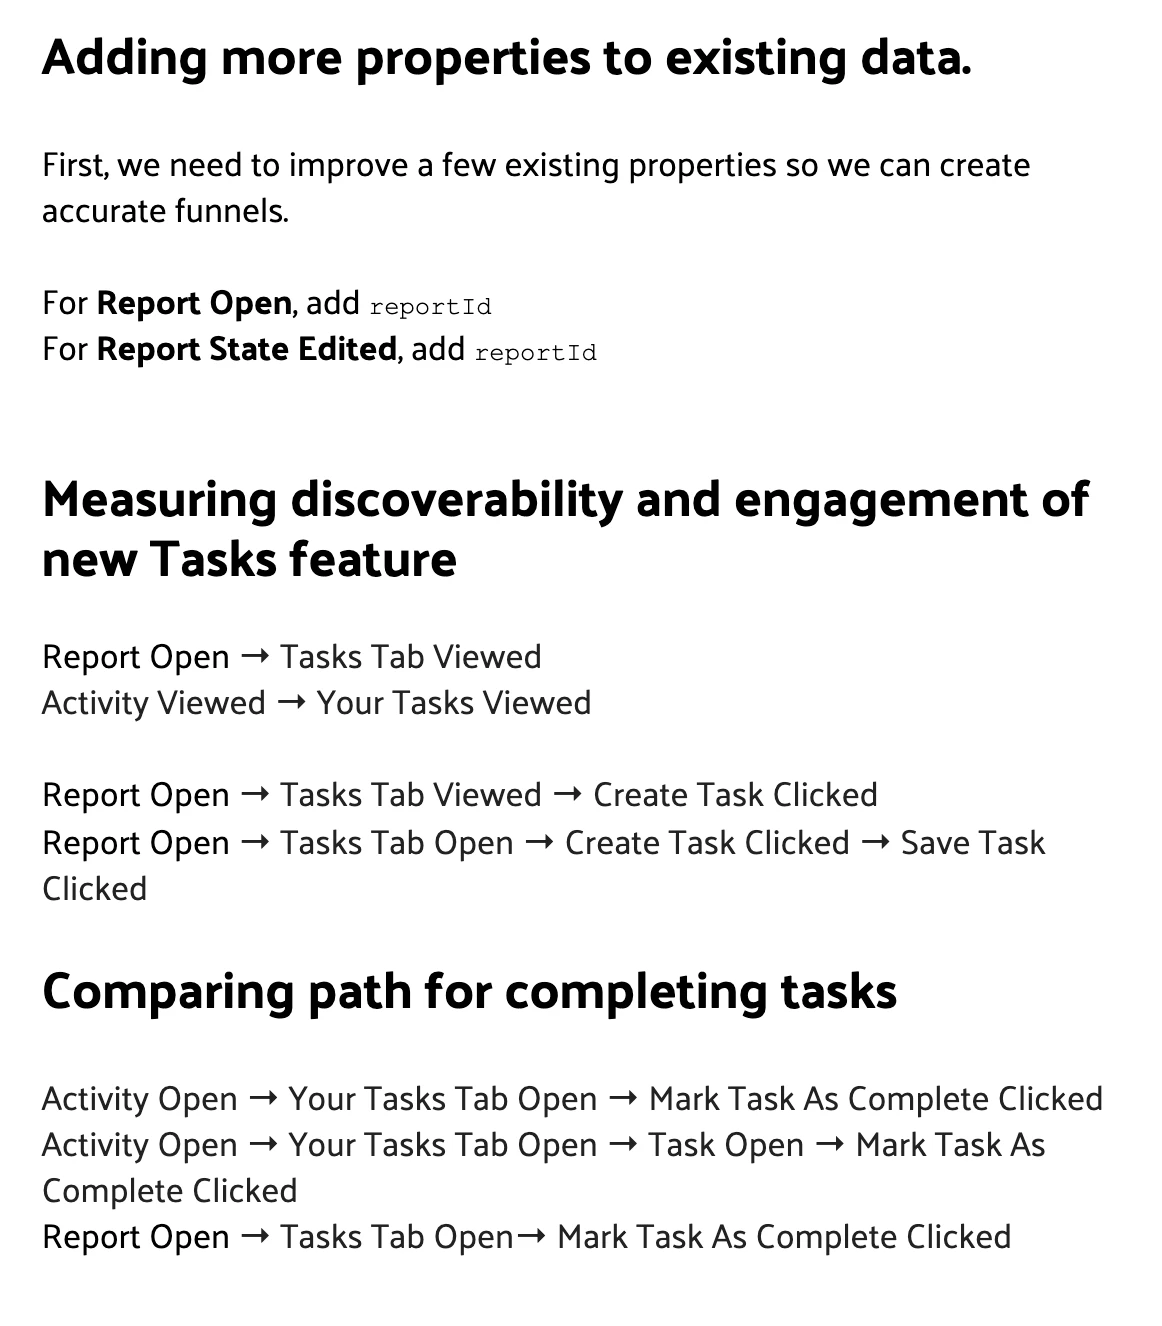
I wanted to ensure we learn early how our users utilize this new feature and in what ways we can improve it. SaferMe already used Mixpanel for some data, however, it was quite limited. To create accurate requirements on which data points we need to track, I first identified what funnels we want to create to learn about user behaviours. Then, I outlined specific metrics we needed to add to make these funnels possible.
The conclusion
The Tasks feature has been living in our product for a year. We are now looking into automating tasks to help our customers create actions without a need to do so manually.